The Fulbright U.S. Student Program for Study/Research Awards are some of the most competitive and prestigious national fellowships for study and research abroad. Each year, graduating seniors and young professionals can apply for one grant in approximately 140 countries, which means selecting a country is a critical part of the Fulbright application. Candidates often ask what are the most and least competitive countries for securing a Fulbright award.
Fortunately, Fulbright publishes the application and award statistics for each country for the last three application cycles. The information provided by Fulbright isn’t easily sortable, so we’ve crunched the numbers for the last three complete years (2013 – 2016) of the Fulbright U.S. Student Program for Study/Research grant statistics to answer the most burning questions asked by Fulbright applicants. (Note, these statistics exclude the Fulbright English Teaching Assistant [ETA] grants).
We’ve published a new Fulbright U.S. Student Grant stats article for the 2024-2025 application! 10 Must-Know Fulbright U.S. Student Study/Research Grant Statistics for the 2024-2025 Awards.
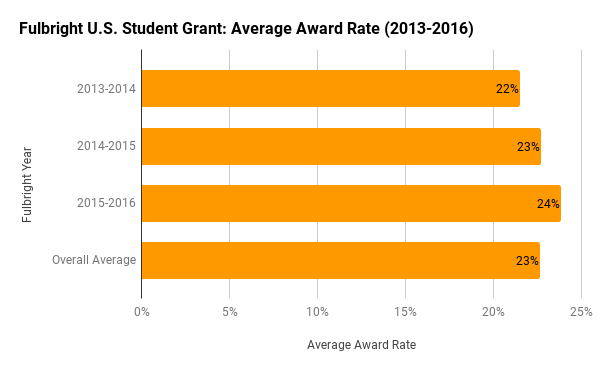
What is the award rate for the Fulbright U.S. Student Grant?
The total award rate for all country grants over the last three years is approximately 23%, meaning about 1 in every 4.3 applicants is awarded a Fulbright grant. In 2015-16, approximately 24% of applicants received a grant, up slightly from 22% in 2013-14 and 23% in 2014-15.
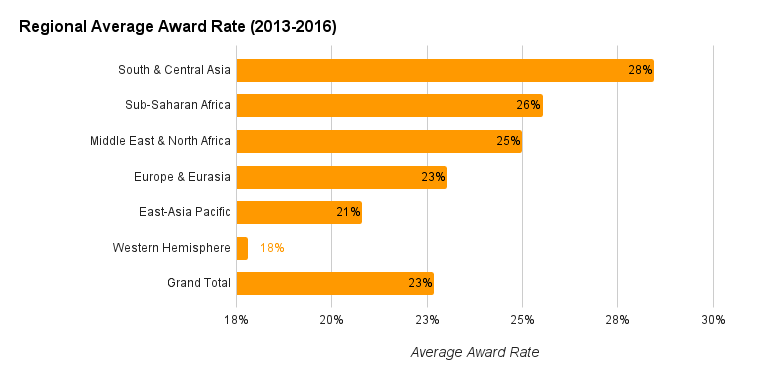
It’s also useful to know the average award rate by region. The South and Central Asia region has the highest three-year average award rate of 28%, followed by the Sub-Saharan Africa region (26%) and the Middle East and North Africa region (25%). The Western Hemisphere, which includes Central & South America and Canada, has the lowest three-year average award rate at 18%.
It’s unknown if the slight upward trend for the total award rate will continue, particularly if the program faces federal budget cuts, but for now, we can assume close to a 23% award rate for the 2018-19 awards.
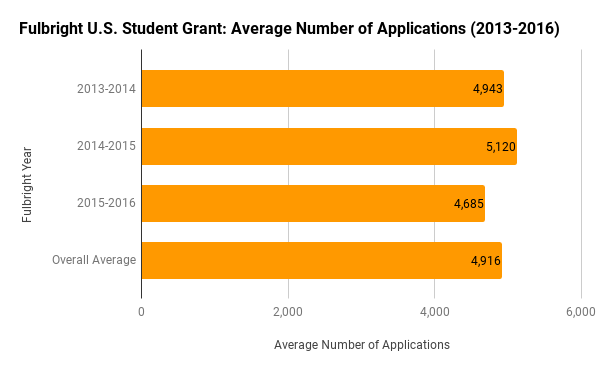
How many applications for the Fulbright U.S. Student Grant for Study/Research are received each year?
Between 2013-2016, the average number of applications received annually was 4,916. There was a clear drop in the number of applications in 2015-2016, but it’s hard to say if these numbers will go up again in 2018-19.
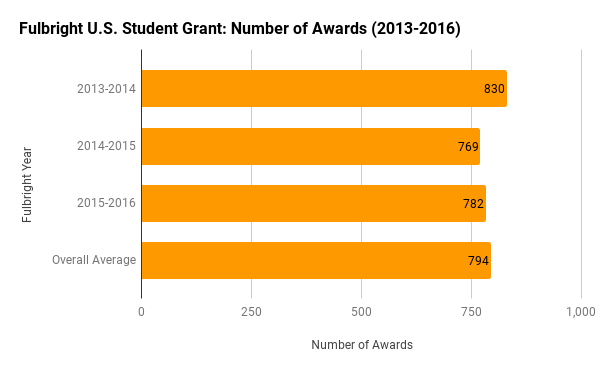
How many Fulbright U.S. Student Grants for Study/Research are awarded each year?
The total number of awards decreased significantly to 769 in 2014-15, but then increased slightly to 782 in 2015-16. On average, Fulbright grants about 794 awards a year.
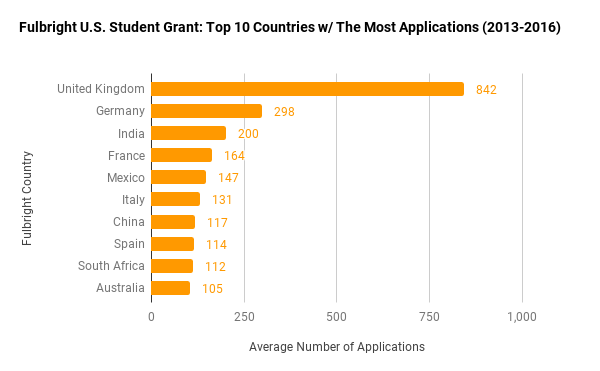
Which Fulbright U.S. Student Grant countries receive the most applications for Study/Research?
Country rates have not changed much over the past three years. The United Kingdom receives the most applications on average (842), almost three times that of Germany (298), the next runner up. Other popular countries include India, France, Mexico, Italy, China, Spain, South Africa and Australia, with average application numbers ranging from 105 to 200.
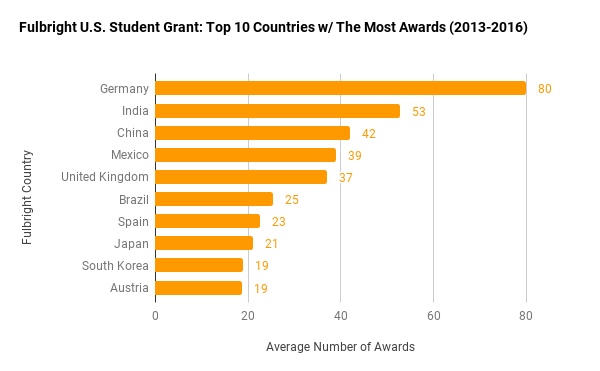
Which Fulbright U.S. Student Grant countries award the most Study/Research grants?
For countries that award the most study/research grants, there is some correspondence with countries that receive the most applications. Germany continues to top the list with 80 annual awards on average, even though it receives a third of the applications of the United Kingdom. Next up is India (53), China (42), Mexico (39), and the United Kingdom (37). Although less popular, Brazil grants an average of 25 awards, Japan grants an average of 21 awards and Austria grants an average of 19 awards – those are countries to consider!
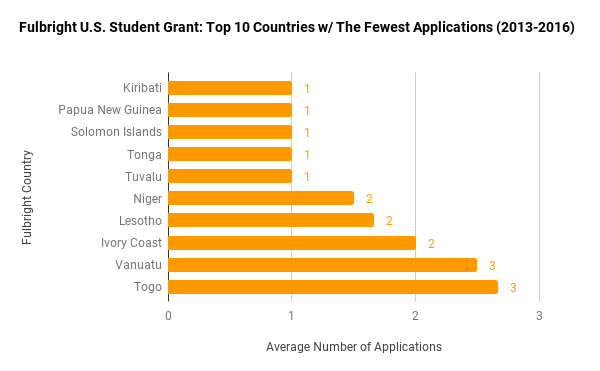
Which Fulbright U.S. Student Grant countries receive the fewest applications for Study/Research?
Candidates are always interested to know which countries are the least competitive. On average, there are more than 23 countries that receive less than 5 applications each year. Kiribati, Papua New Guinea, Solomon Islands, Tonga and Tuvalu, small South Pacific Island Nations, receive on average only 1 application a year! In these places, knowledge of a local language is encouraged but not required. Also, in these places, only research projects are accepted; graduate degree enrollment is not possible.
Niger, Lesotho and Ivory Coast receive on average only 2 applications a year. Niger, in West Africa, requires intermediate French language proficiency. A research project in Lesotho, in Southern Africa, can be conducted in English (fluency in Sesotho may be helpful but is not required). Ivory Coast (also known as Cote d’Ivoire) requires candidates to have a doctoral degree and intermediate French language fluency. Candidates may propose to conduct research in Teaching English as a Foreign Language, the medical sciences, biological sciences, and French studies, among other fields.
Other countries with less than 5 applications on average per year include Vanuatu, Togo, Congo, Kuwait, Slovak Republic, Swaziland, and Uzbekistan.
It’s important to keep in mind that these countries do not necessarily grant Fulbright awards every year. The Fulbright Commission stresses that awards will be made based on the quality of the application.
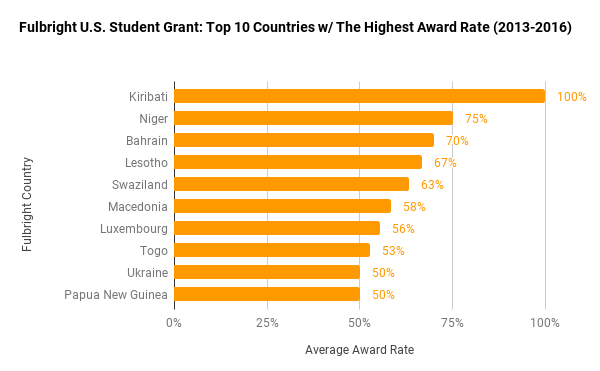
Which Fulbright U.S. Student Grant countries have the highest award rate for Study/Research?
Eight out of the top ten countries grant awards to more than half their applicants on average. There are two primary reasons for these high rates. First, some countries do not give awards every year, and second, they all receive a small number of applications, 5 on average. Topping the list this year are Kiribati, a small South Pacific Island (100%, with 0–1 applications a year); Niger in West Africa (75%, with 0–2 applications per year); Bahrain in the Middle East (70%, with 0–5 applications a year); Lesotho in Southern Africa (67%, with 1–2 applications per year) and Swaziland in Southern Africa (63%, with 1–5 applications per year). Other countries with high average award rates include Macedonia, Luxembourg, Togo, Ukraine, and Papua New Guinea.
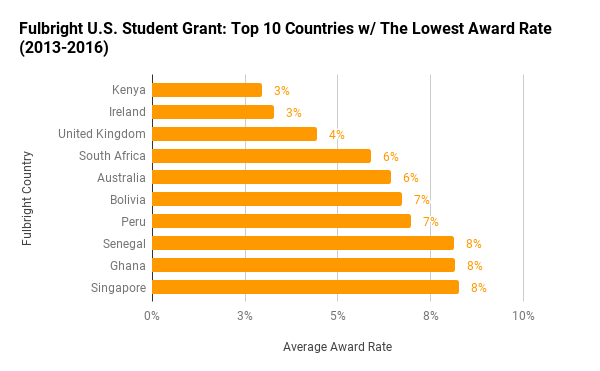
Which Fulbright U.S. Student Grant countries have the lowest award rate for Study/Research?
We found seven countries with an average award rate of 0% that we decided to exclude, because in most cases they were countries in areas of conflict (e.g., Egypt and Venezuela) or offered awards in only once in the last three years. With those removed, Kenya and Ireland topped the list with an average award rate of just 3%. Not far behind are the United Kingdom (4%), South Africa (6%), Australia (6%), Bolivia (7%) and Peru (7%). Senegal, Ghana and Singapore are also highly competitive with an average award rate of 8%.
These low award rates should not dissuade you from applying to these countries if you have a well-structured project that can only be conducted in these locations. However, you may find equally interesting and challenging Fulbright experiences to be had in countries in the same region with similar language requirements. Be open-minded and look into all possibilities!
Conclusion
Application statistics are one tool to help you determine which country to apply to for a Fulbright U.S. Student Grant for study or research. However, they shouldn’t be your only consideration. No matter where you apply, Fulbright is highly selective and will not grant an award for an application that is not excellent, sound and compelling. Check out university Fulbright advisor and Fulbright alumna Zoë Gioja’s Tips for Fulbright Applicants: How to Choose the Right Grant. Also be sure to check out:
- New 2018-19 Fulbright U.S. Student Program Awards for Students and Young Professionals
- The Top 10 FAQs for the 2018-19 Fulbright U.S. Student Program for Study/Research
- How to Create Your Summer Fulbright Application Plan: 2018-19 U.S. Applicants
- and our full series on Fulbright Application Tips.
We’ve published a new Fulbright U.S. Student Grant stats article for the 2024-2025 application! 10 Must-Know Fulbright U.S. Student Study/Research Grant Statistics for the 2024-2025 Awards.
© Victoria Johnson 2017, all rights reserved.