With more than 140 countries to choose from, applying to the Fulbright U.S. Student Program for Study/Research Grants can be a daunting task. Each country has different requirements ranging from degrees attained to language fluency. Not to mention, many applicants gravitate toward the same countries, which makes the application process very competitive. It seems everyone wants to go to the United Kingdom or Australia. So where do you start?
Thankfully Fulbright knows your pain and publishes the application and award statistics for each country for the last three application cycles. However, the information isn’t sortable and some columns include only partial information. That’s where we come in! We crunched the numbers for the last four complete years of the Fulbright U.S. Student Program for study/research statistics – years 2011-2015 – to answer the most burning questions asked by Fulbright applicants. Here are your questions and answers.
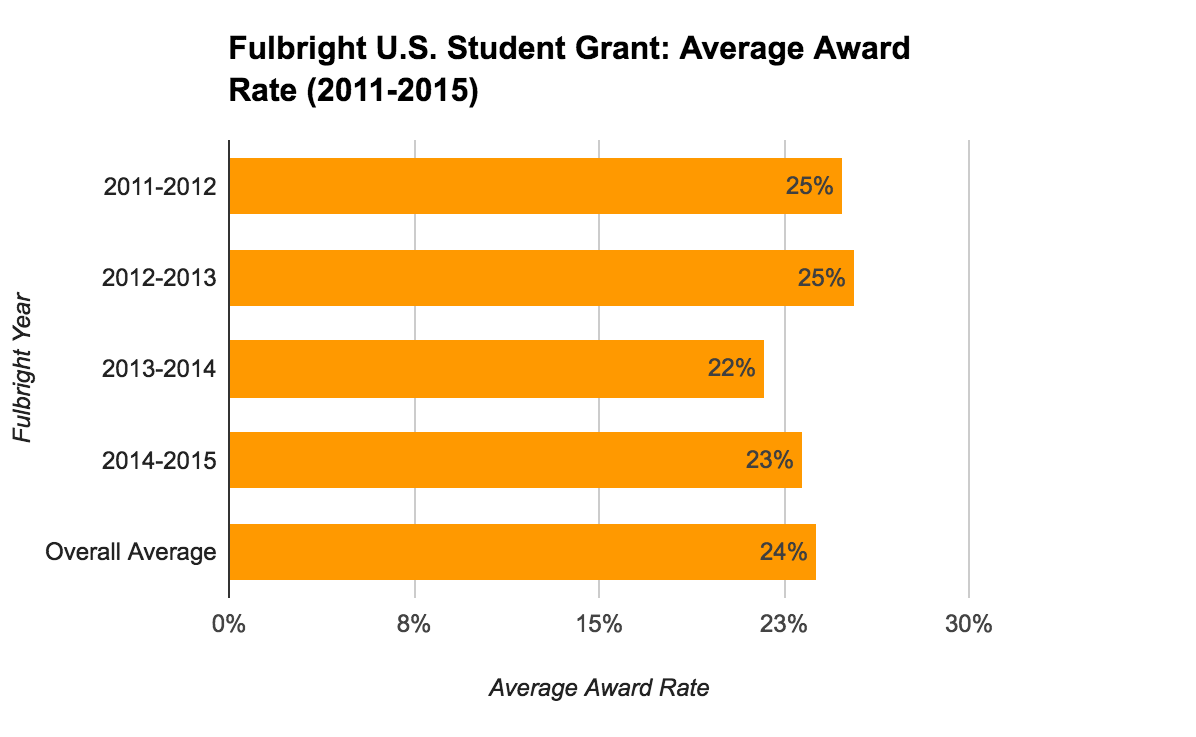
What is the award rate for the Fulbright U.S. Student Grant?
The answer commonly given to this question is 20%, but after analyzing the numbers we found that the award rate is actually a bit higher. From 2011-2015, the average award rate was 24%. However, over the last two years the Fulbright U.S. Student Program has become more competitive. This is due to a number of factors, but the primary ones are that there are fewer Fulbright country programs now than there was in 2011-2012 and Fulbright is granting fewer awards.
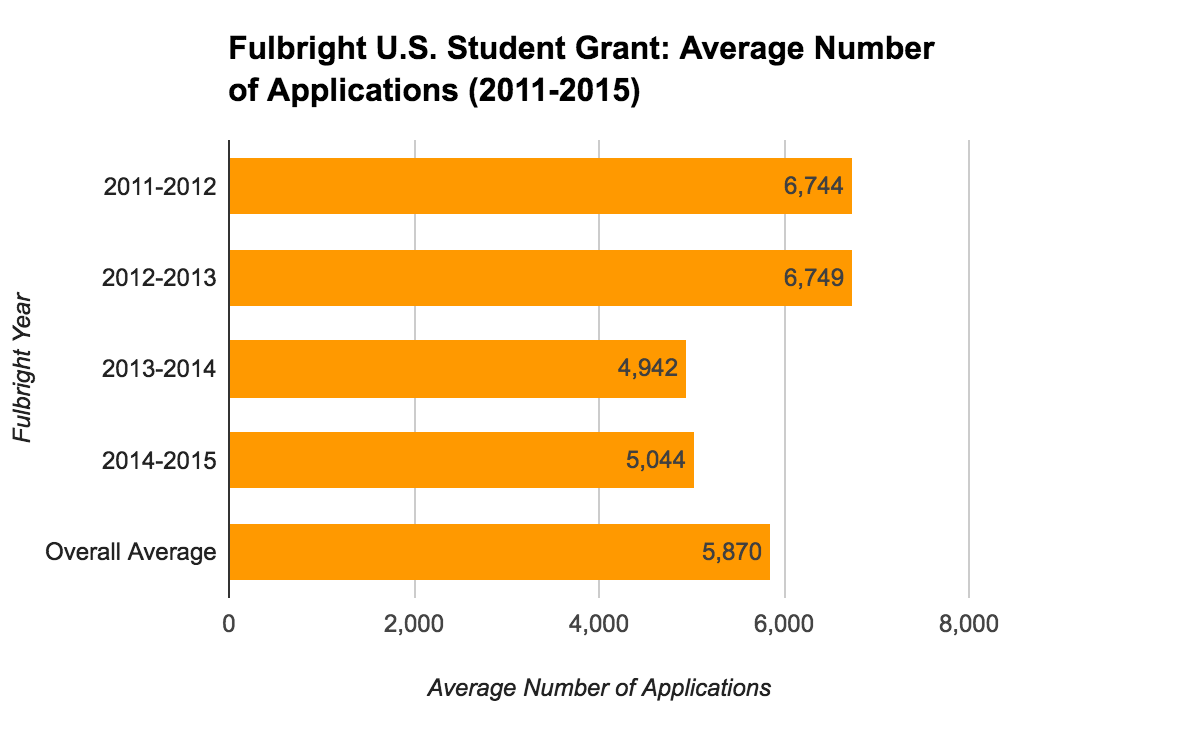
How many Fulbright U.S. Student Grant applications are received each year?
Between 2011-2015 the average number of applications received annually was 5,870. Looking at the data you can see a clear drop in the number of applications in 2013-2014. This could be due to a decrease in the number of Fulbright country programs offered that year.
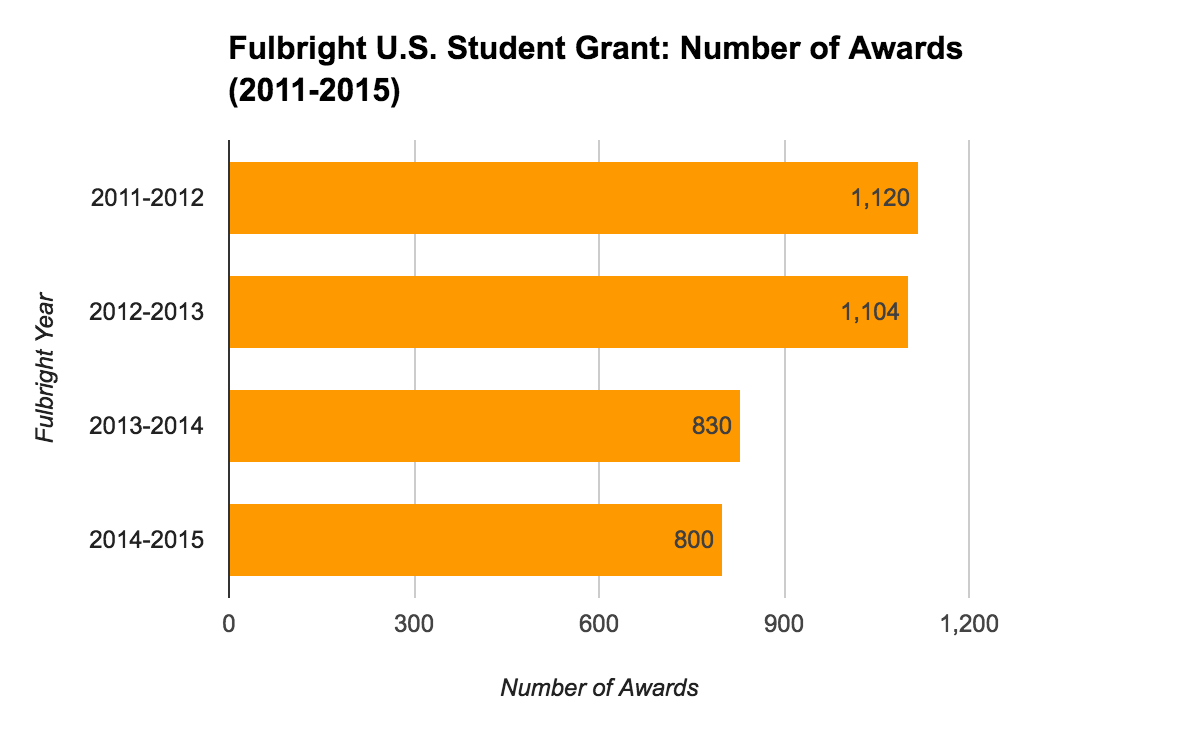
How many Fulbright U.S. Student Grants are awarded each year?
The total number of awards each year has steadily decreased from more than 1,100 in 2011-12 to 800 in 2014-15. This drop appears to directly correspond to the decreased number of Fulbright country programs offered.
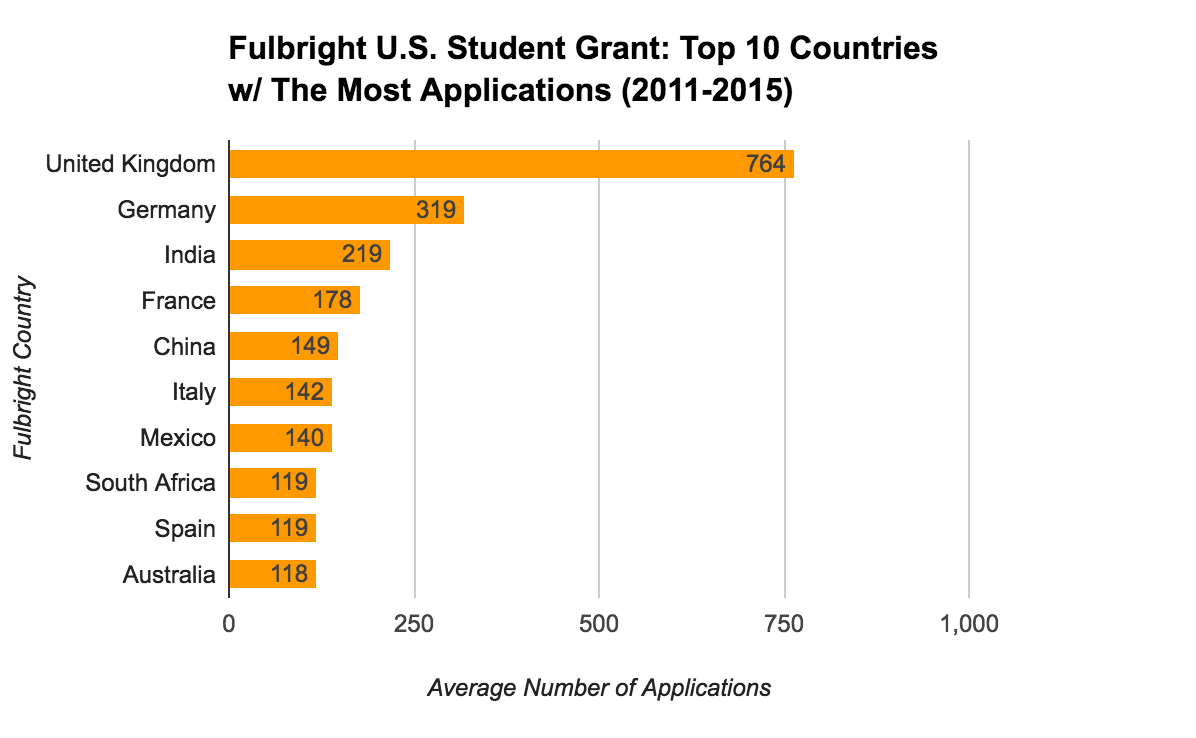
Which Fulbright U.S. Student Grant countries receive the most applications?
The United Kingdom receives the most applications on average, more than twice that of Germany, the next runner up. Other popular countries include English-speaking countries like India, South Africa and Australia, and top tourist destinations like France, Italy, Mexico and Spain.
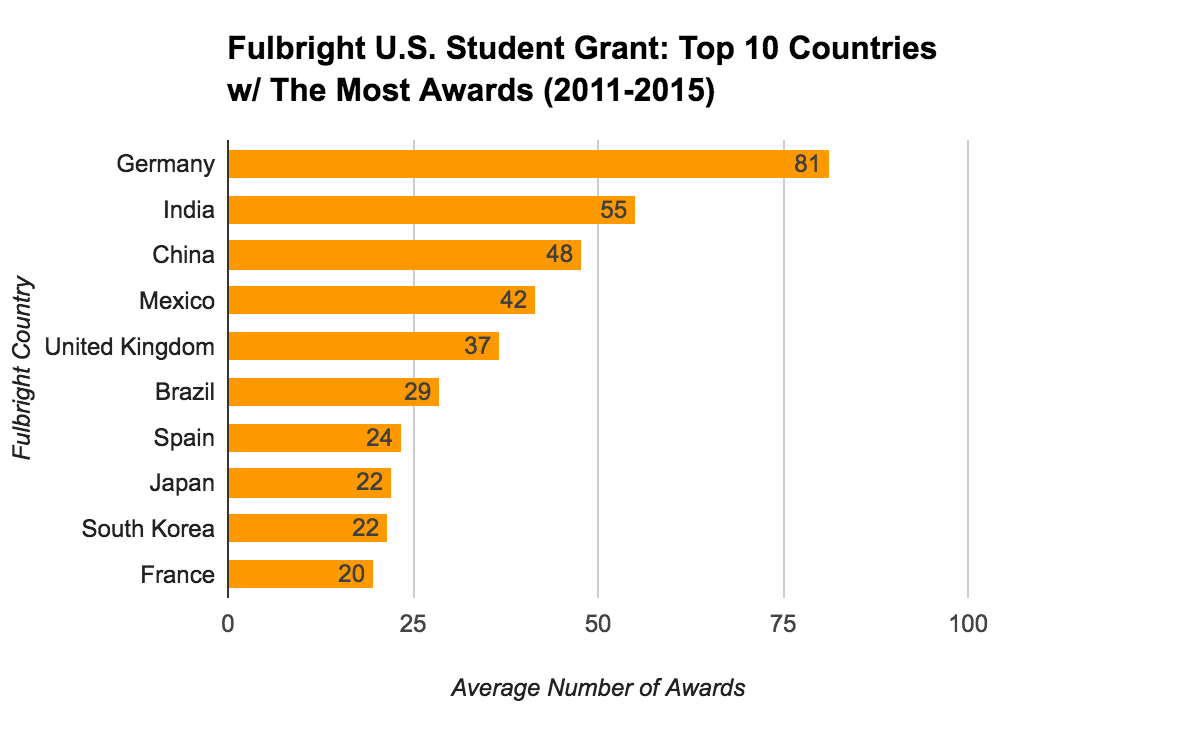
Which Fulbright U.S. Student Grant countries award the most study/research grants?
You may be surprised that this list doesn’t correspond to the countries that receive the most applications. Germany tops the list with 81 annual awards on average, even though it receives half the applications of the United Kingdom. Conversely, the United Kingdom grants less than half the awards that Germany does – 37 on average. India, China and Mexico also top the list, offering more than 40 awards per year on average.
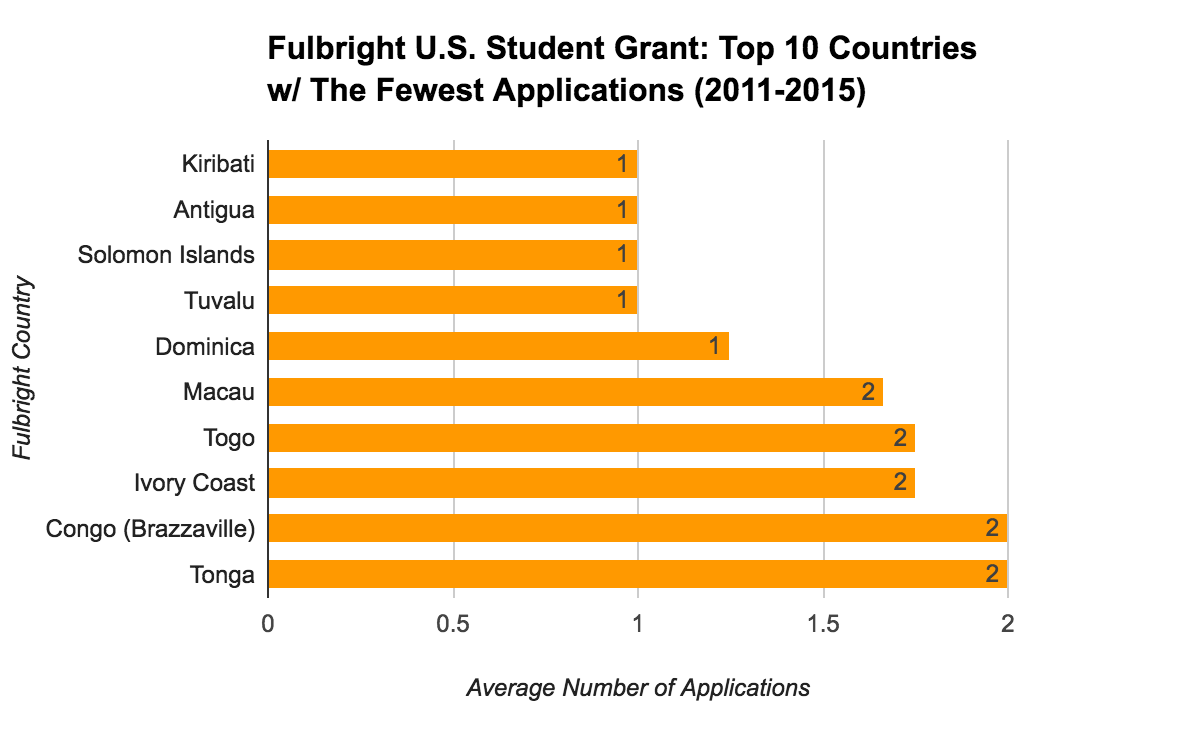
Which Fulbright U.S. Student Grant countries receive the fewest applications?
Now that you know how competitive some of the most popular countries are, I bet you’re wondering which countries are the least competitive. Turns out there are more than 50 countries that on average receive 10 or fewer applications each year. Topping the list are Kiribati, Antigua, Solomon Islands, Tuvalu, and Dominica, small tropical island nations that receive on average only 1 application a year! Kiribati, Solomon Islands and Tuvalu are among South Pacific Island Nations offering Fulbright awards. In these places, knowledge of a local language is encouraged but not required. Antigua and Dominica are island nations part of the Barbados and Eastern Caribbean Fulbright U.S. student program that offer funding for Master’s thesis or PhD dissertation research only.
It’s important to keep in mind that not all of these countries offer Fulbright awards every year, so be sure to double check the Fulbright website before beginning your application.
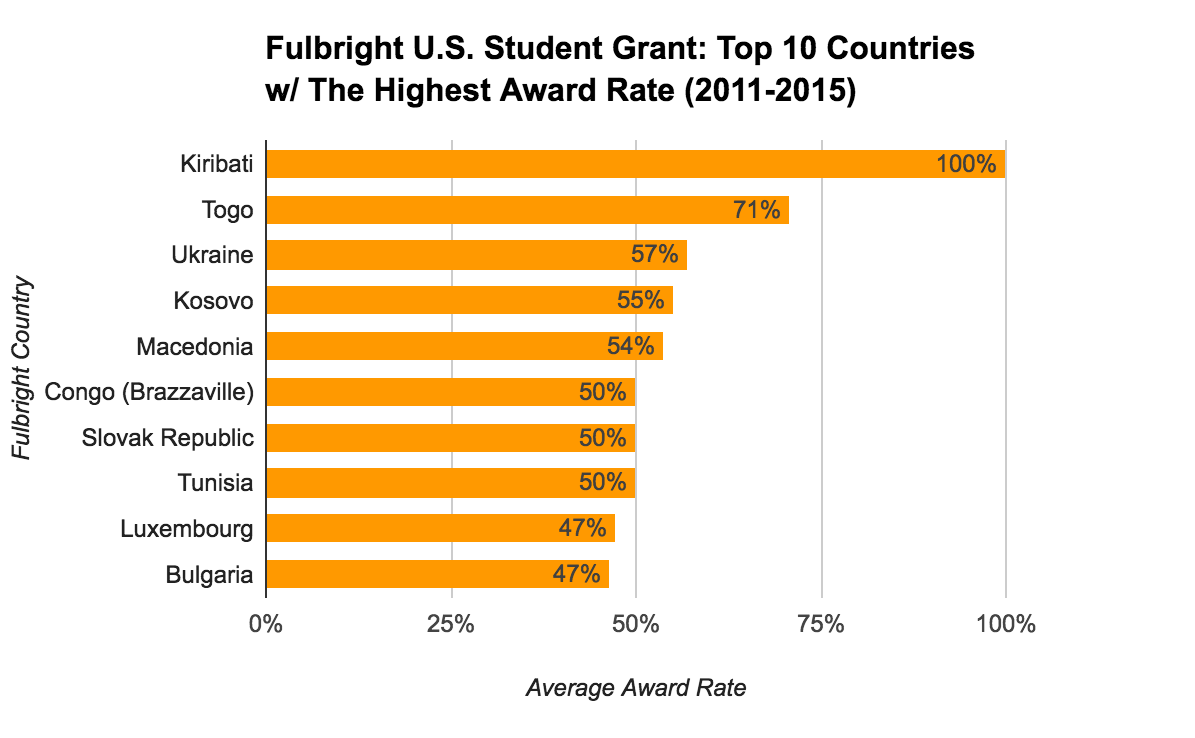
Which Fulbright U.S. Student Grant countries have the highest award rate?
Eight out of the top ten countries with the highest award rate have an average award rate of 50% or more. There are two primary reasons for these high rates. First, some countries do not give awards every year, and second, they all receive a small number of applications, 5 on average. Topping the list are Kiribati, a small Pacific Island; Togo, a West African country sandwiched between Ghana and Benin; Ukraine, an Eastern Europe/post-Soviet bloc destination; Kosovo, a formerly war-torn Balkan state now experiencing a comeback; and Macedonia, just south of Kosovo and north of Greece, one of the successor states of the former Yugoslavia. Click the links above to read about the experiences of former Fulbright grantees in these countries.
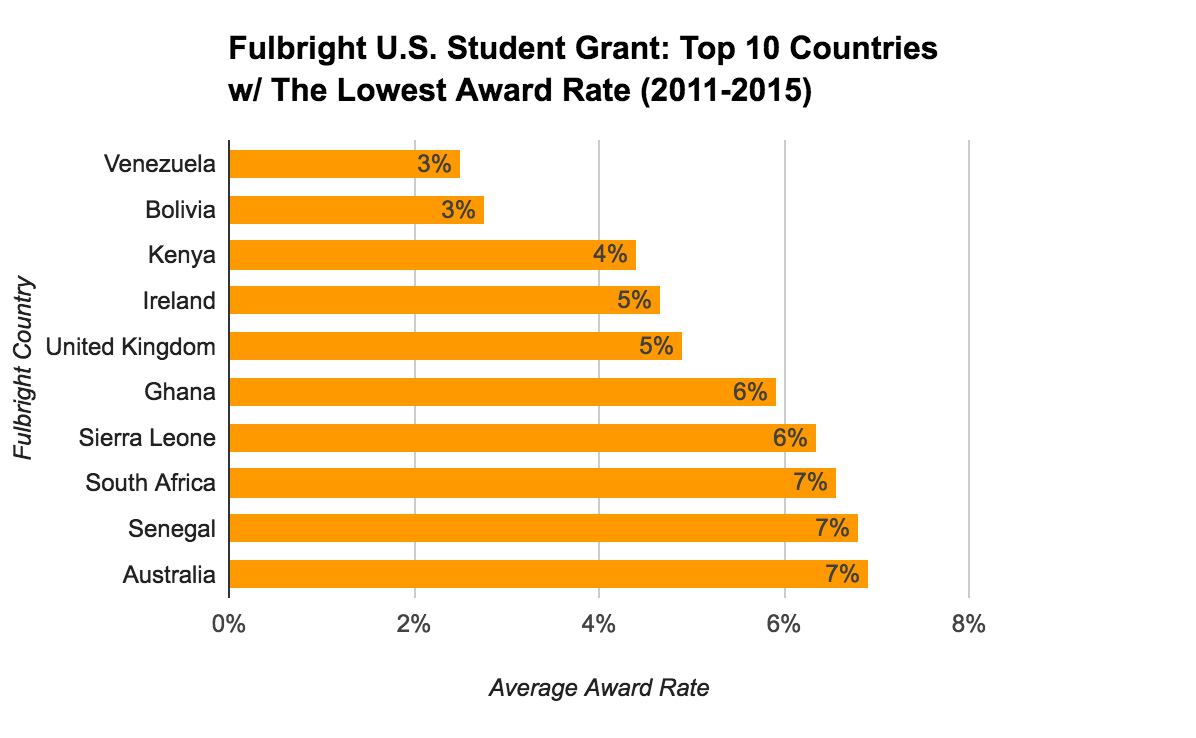
Which Fulbright U.S. Student Grant countries have the lowest award rate?
We found eight countries with an average award rate of 0%, which after looking at the data we decided to exclude, because in most cases they were countries in areas of conflict or offered awards in only one out of the last four years. With those removed, Venezuela, Bolivia and Kenya topped the list, followed by American student favorites, Ireland and the United Kingdom.
Conclusion
The statistics are not intended to imply that you should apply to a particular Fulbright country because it has a high award rate or low number of applications. No matter where you apply, Fulbright is highly selective and will not grant an award for an application that is not excellent, sound and compelling. However, these statistics and the links to Fulbright stories within may give you inspiration to consider applying to a country “off the beaten path.” Be prepared for your Fulbright application by contacting your university’s Fulbright advisor as early as possible, checking in particular for internal deadlines and application requirements.
Also check out:
- 8 Must Know Fulbright ETA Statistics for 2017-2018
- 10 Alternatives to the Fulbright U.S. Student Grant in 2017
- and sign up to browse our free database of more than 800 funded fellowships.
© Victoria Johnson 2016, all rights reserved.
The Fulbright US Student Program includes several categories of awards. There are the research/ study open grants, the English Teaching Assistant (ETA) grant, National Geographic Digital Storytelling Award, and several partnership awards. Based on the numbers, it appears your analysis excludes several categories. Overall, the US Student Program attracts between 10,000 and 11,000 applications. I’m guessing you’ve excluded at least the ETA program. Is that correct? How about the partnership awards? In short, which components of the US Student Program are you including and which are you excluding?
Hi Phillip, the statistics just include the U.S. Student Program grants for study & research. It does not include ETA, but we are preparing a new article on those statistics soon! It also does not include statistics for the Fulbright-Clinton Fellowships, the Fulbright/Fogarty Awards, the Fulbright mtv-U Award or the Fulbright-National Geographic Digital Storytelling Fellowship. You can view all of the statistics that Fulbright publishes here: http://us.fulbrightonline.org/statistics
How much are Fulbright awards and are special privileges granted to hungry Bureau of Indians/Seminoles who crave Korean food in State College, PA?