If you have decided to apply for a Fulbright U.S. Student Grant, you are in good company. As one of the most prestigious awards granted for global study and research, it follows that it is also one of the most competitive. The more you know before you submit your application, the better. Arming yourself with the statistics of the frequency of awards according to region will help you streamline your application, ensuring that you steer towards your greatest chance of success. And best to do so now! This year’s application deadline is October 9, 2018.
We’ve published a new Fulbright stats article for the 2024-2025 application! 10 Must-Know Fulbright U.S. Student Study/Research Grant Statistics for the 2024-2025 Awards
Last year, we brought you the 8 Essential Fulbright U.S. Student Grant Statistics for the 2018-19 Awards. We found that our readers appreciated having the information distilled for them, so we have this year’s update! While Fulbright does publish their application and award statistics per three-year periods, it can take some time to find the information that you are looking for. Our aim is to provide you with a resource that is condensed and easily navigable so that you can focus your time and efforts on creating a strong application rather than sifting through information. Please be aware that this article focuses on the Fulbright U.S. Student Grant for Study/Research and does not include the statistics on the Fulbright English Teaching Assistant (ETA) grants.
Time to dive in! Here are the 8 must-know Fulbright award statistics for the 2019-20 grant year.
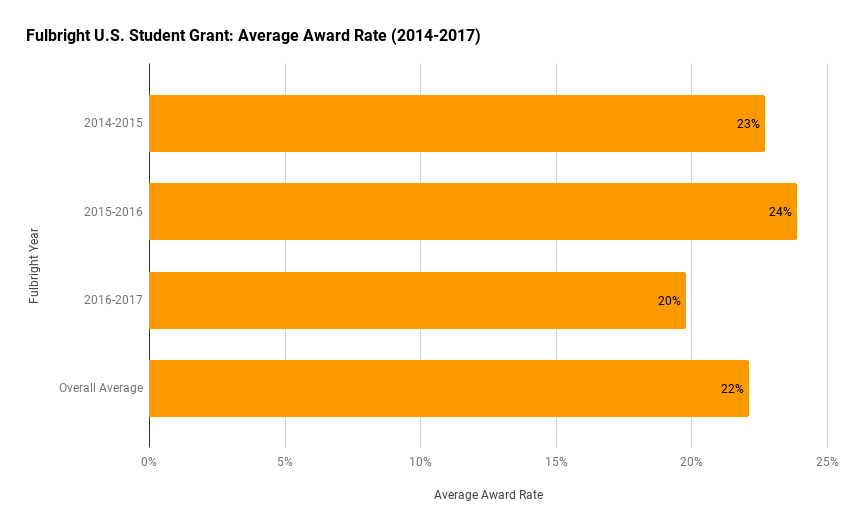
What is the average award rate for the Fulbright U.S. Student Grant?
The total award rate for the Fulbright U.S. Student Grant in the 2016-17 period was 20%. This means that 1 in 5 applications was successful. The award rate is down from the previous two years – 24% in 2015-16 year and 23% in 2014-15.
The next question is how these award rates were broken up per region. Let’s have a look.
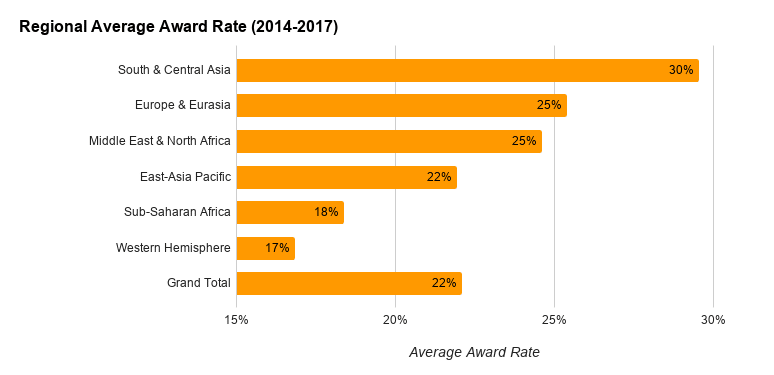
As you can see, South and Central Asia has the greatest average award rate of 30% for the period between 2014 and 2017. This number is up slightly from the 2013-16 period, which was 28%. The regions of Europe and Eurasia and the Middle East and North Africa both sit at 25%. The former is slightly up from last year, while the latter is approximately on par with the previous period. The region of Sub-Saharan Africa has seen the most marked shift, declining from 26% in 2013-16 to 18% in the current period. The Western Hemisphere has only seen a slight downturn from 18% to 17%.
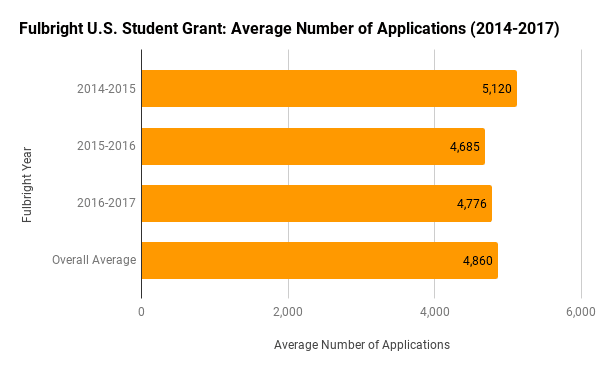
How many applications for the Fulbright U.S. Student Grant for Study/ Research are received each year?
While up slightly from the previous year, the overall number of applications received has decreased substantially since the 2014-15 year. The 3-year average of 4,860 applications is down from last year’s assessment of 4,916. It is uncertain whether we are looking at a more long-term downturn, or if these numbers will swing up again.
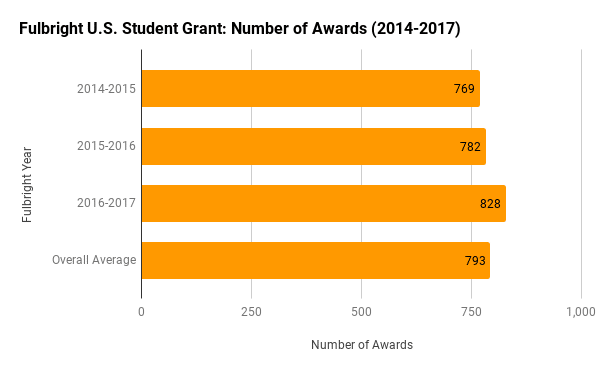
Of the Fulbright applications received, how many are successful each year?
And of course the next question is, how many of those applications receive responses that include the words, “we’re pleased to inform you”? After a decline in the number of awards given in 2014-15 (down from 830 in 2013-14), it appears that it’s on the upswing again. While there was a substantial climb in 2016-17, the overall average has remained approximately the same at 793 from the previous three years’ 794.
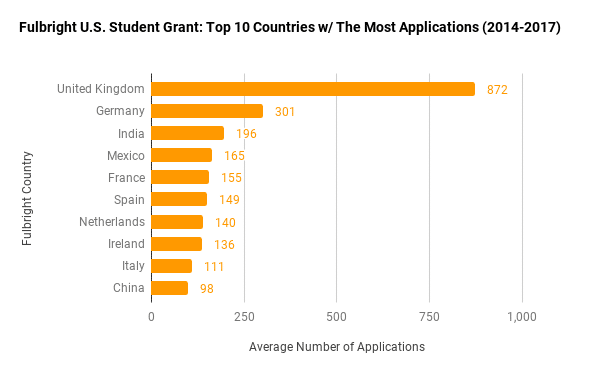
Which Fulbright countries receive the highest number of applications each year from U.S. Students and Researchers?
As was the case in the 2013-2016 period, the 2014-17 period saw the number of applications to the UK far exceed that of any other country—up to 897 from the previous period’s 842. The number of applications to Germany, in a distant second place, is at the exact same figure as it was in the previous three years. South Africa did not make it to the Top 10 list as it has done so before, being replaced by the Netherlands who have received an increased number of applications.
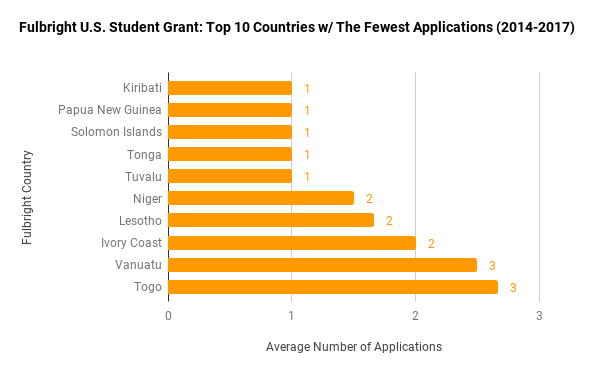
Which Fulbright countries receive the fewest number of applications each year from U.S. Students and Researchers?
Knowing which countries receive the fewest amount of applications can be significant when it comes to targeting your application. It’s important to note that the countries on the Top 10 list are the same as the ones in the 2013-16 period. Furthermore, their ranking on the list is also the same. All these countries receive less than 5 applications a year.
You might be surprised to learn that countries including Kiribati, Papua New Guinea, the Solomon Islands, Tonga and Tuvalu, receive on average only 1 application a year. Similarly, Niger, Lesotho, Cote d’Ivoire, Vanuatu and Togo all receive fewer than five applicants a year. These countries are eager for great applicants.
However, applying to countries that receive fewer applications does not mean that you can forego the quality of your submission. It is not advisable to apply to a country solely because there is less competition. You must have the requisite skills to carry out a program of study or research in these countries. Also, Fulbright will not necessarily award grants in those countries every year, so your priority is to prove to them that they should.
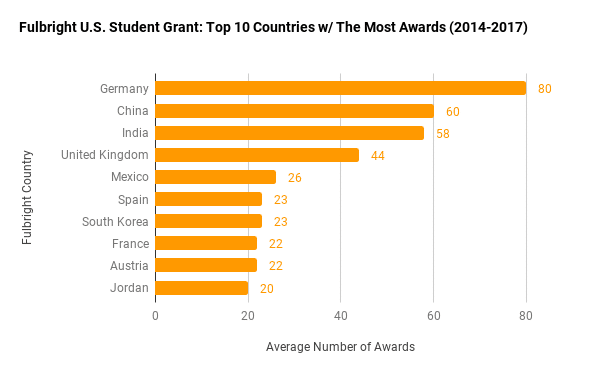
Which Fulbright countries award the highest number of study and research grants under the U.S. Student program?
Germany is at the top of the pile once again, having awarded 80 grants in the 2014-2017 period. This is the same number they awarded in the previous period. China has overtaken India as the runner up, now awarding 60 grants, which is up from the previous number of 42. The number of grants in India is up slightly to 58. Other countries giving 20 or more awards each year include the UK, Mexico, Spain, South Korea, France, Austria and Jordan.
Which Fulbright U.S. Student Grant countries have the highest award rate for Study/Research?
What does this information mean for the award rate by country? Ukraine is at the top in this period awarding grants to an average of 69% of its applicants, up from its previous average of 50%. Most countries on the Top 10 list—Malaysia, Niger, Papua New Guinea, Lesotho, Kuwait, Swaziland and Luxembourg —awarded grants to half of their applicants. Bulgaria comes in next at a 46% award rate.

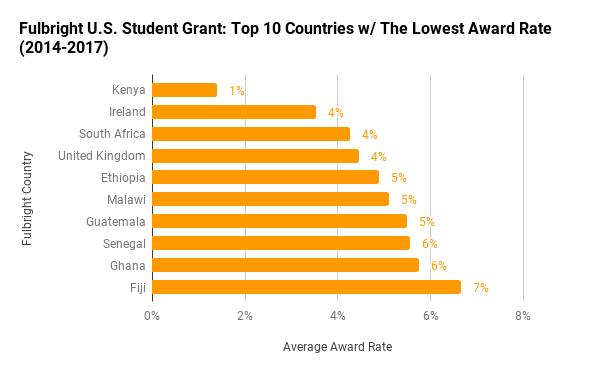
Which Fulbright U.S. Student Grant countries have the lowest award rate for Study/Research?
The Top 10 countries on the other end of the spectrum all have an award rate of less than 10%. Kenya only awarded grants to 1% of applicants. Ireland, South Africa and the United Kingdom have a 4% success rate, while Ethiopia, Malawi, Guatemala, Senegal, Ghana and Tanzania all hover between 5% and 7%.
Conclusion
The more informed you are about how Fulbright U.S. Student grants are awarded, the better your chance of success. This does not mean that you should focus solely on countries that look to have the lowest barrier to entry. Having a solid, well-thought-out Personal Statement and Statement of Grant Purpose will bring you closest to success, no matter what region you are applying to.
Here are a few resources to help you get on the right side of the statistics:
- 100+ Countries Where You Can Pursue a Fulbright Award in English
- 5 Reasons Why You Should Compete for the International Fulbright Awards
- 5 Feasible Research Methods for your Fulbright Research Proposal
Best of luck with your application!
Want insider strategies for your Fulbright U.S. Student Grant application? Purchase the Fulbright Applicant Mastermind workshop by ProFellow Founder and Fulbright Award Winner, Dr. Vicki Johnson.
© Victoria Johnson 2017, all rights reserved.