With awards offered in over 130 countries – each with different requirements and levels of competitiveness – the application process for the Fulbright U.S. Student Study/Research Awards can be overwhelming, even with the help of your university fellowship office. Fulbright Study/Research Awards fund independent research and creative projects or graduate study abroad. This article includes the must-know statistics for the 2024-2025 Fulbright U.S. Student Study/Research Awards, including which regions and countries are the most competitive, which award the most grants/scholarships, and which have no foreign language requirements!
The 2024-2025 application deadline is Tuesday, October 10, 2023, at 5 pm Eastern Time.
Each year, the Fulbright U.S. Student Program publishes statistics on the number of Study/Research Grant applications and awards for each country for the last three application cycles. Since it can be daunting to sort through the statistics for each country, we crunched the numbers to save you time and provide helpful insights for your application. This article summarizes valuable statistics from the three most recent Fulbright U.S. Student Study/Research Grant application years (2021-2022, 2022-2023, and 2023-2024) published by Fulbright as of July 28, 2023.
Want to gain similar insights into the Fulbright English Teaching Assistant (ETA) Awards? Read 10 Must-Know Fulbright ETA Statistics for the 2024-2025 Awards.
Here are the ten must-know Fulbright U.S. Student Study/Research Grant statistics for the 2024-2025 awards!
1. How competitive is the Fulbright U.S. Student Study/Research Grant?
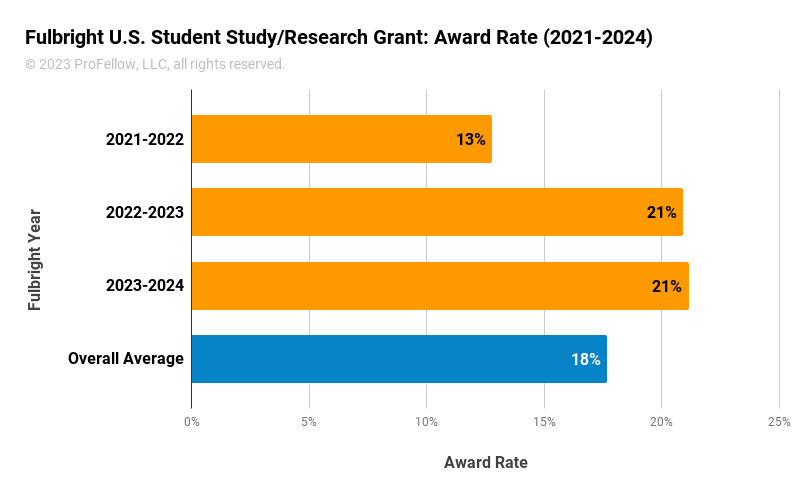
On average, about 1 in 5 applicants receive an award. The average award rate (total awards/applications) from 2021-2024 was 18%. However, the 2021-2022 statistics are the primary reason this number is so low. In 2021-2022 the award rate was 13% due to an increase in applications and a reduced number of Fulbright grants awarded, possibly due to the COVID-19 pandemic. The two most recent application cycles (2022-2023 and 2023-2024) are more representative historically, with an average award rate of 21%.
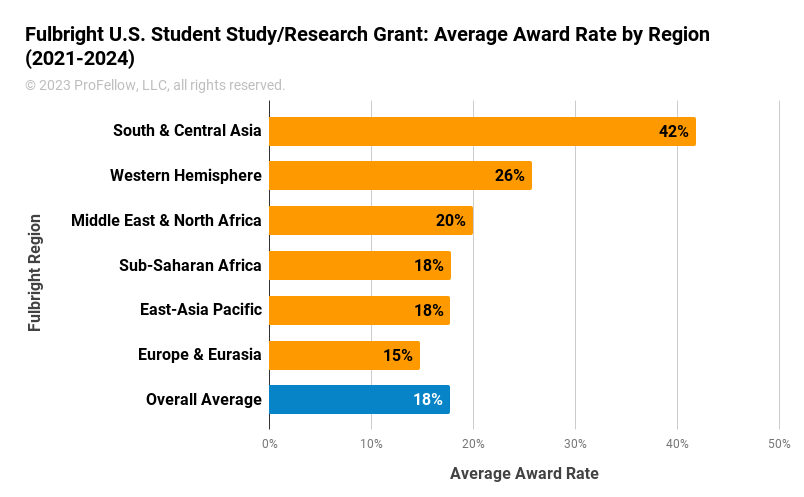
It is important to note that award rates vary significantly by region and country. For example, across the 2021-2024 award years, the South & Central Asia region had the highest average award rate of 42%. The Western Hemisphere followed this (26%), the Middle East & North Africa (20%), Sub-Saharan Africa (18%), and Europe & Eurasia, which had the lowest average award rate of 15%. In 2023-2024, the individual country award rates ranged from 3% (Australia) to 100% (11 countries, including Uruguay, Sri Lanka, Zimbabwe, and Bosnia & Herzegovina).
2. How many Fulbright U.S. Student Study/Research Grant applications are submitted annually?
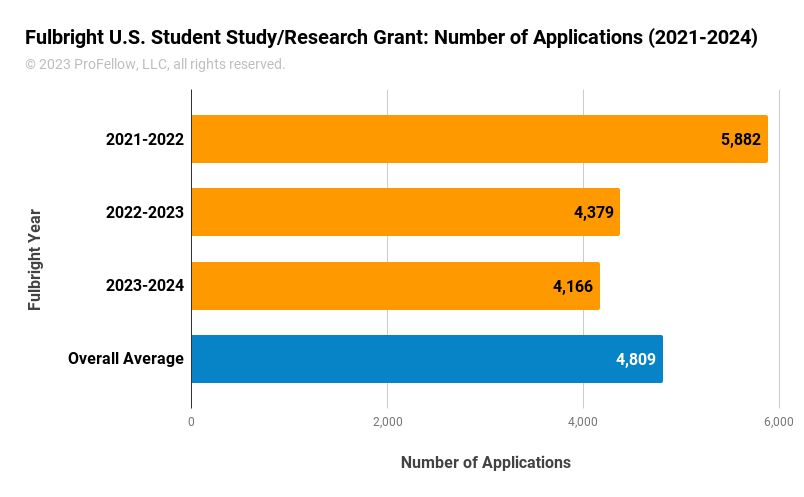
On average, Fulbright receives over 4,000 Fulbright Study/Research Grant applications yearly. The most recent application cycle for 2023-2024 awards received 4,166 applications, a 5% decrease from the previous 2022-2023 cycle’s 4,379 applications. The past two years represent smaller applicant pools than 2021-2022 which received 5,882 applications (38% more than the average number of applications from 2022-2024).
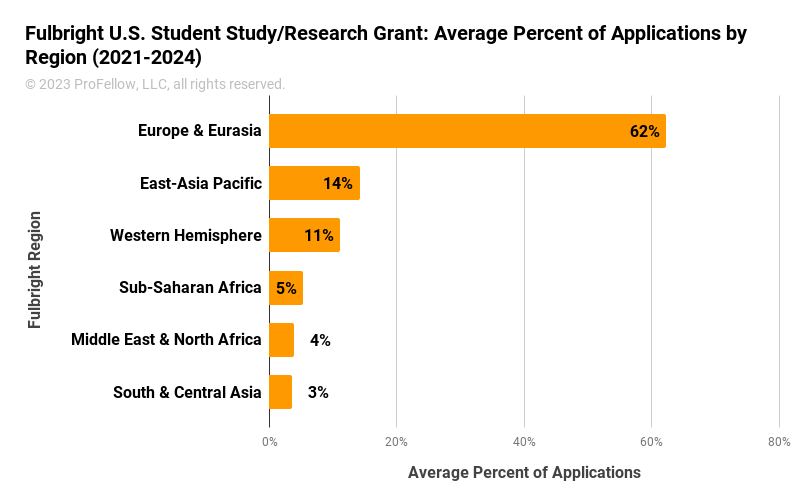
Some Fulbright regions are in much higher demand than others. The Europe & Eurasia region typically receives 62% of all Study/Research applications (about 3,000 applications per year), followed by the East-Asia Pacific region (14%), the Western Hemisphere (11%), Sub-Saharan Africa (5%), the Middle East & North Africa (4%), and South & Central Asia (3%).
The total number of Fulbright U.S. Student Study/Research Grant applications has declined yearly since 2021-2022. This decline has occurred across all regions except for Sub-Saharan Africa, which increased from 215 applications (2022-2023) to 228 applications (2023-2024).
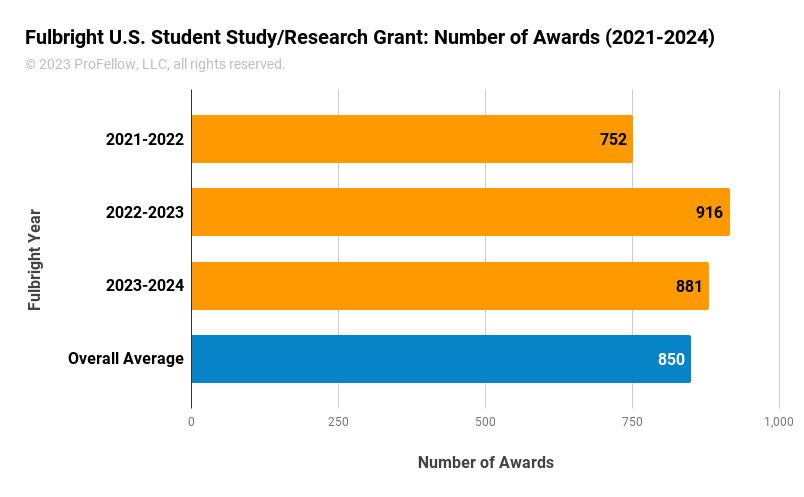
3. How many Fulbright U.S. Student Study/Research Grants are awarded annually?
On average, more than 850 Fulbright Study/Research Grants are awarded to U.S. students annually. While the number of grants awarded varies yearly, the Fulbright U.S. Student Program awarded 881 Study/Research Grants in 2023-2024, a 4% decrease from the 916 awards in 2022-2023 but a 17% increase from the 752 awards in 2021-2022, which was heavily affected by the COVID-19 pandemic.
Fulbright continues to expand opportunities to study and research abroad. Exciting new Study/Research awards for 2024-2025 include opportunities to pursue a graduate degree in France, Egypt, or Taiwan. Fogarty-Fulbright Public Health Awards through the Fulbright Program and the Fogarty International Center at the U.S. National Institutes of Health (NIH) are now providing awards to increase public health and clinical research in 8 new countries.
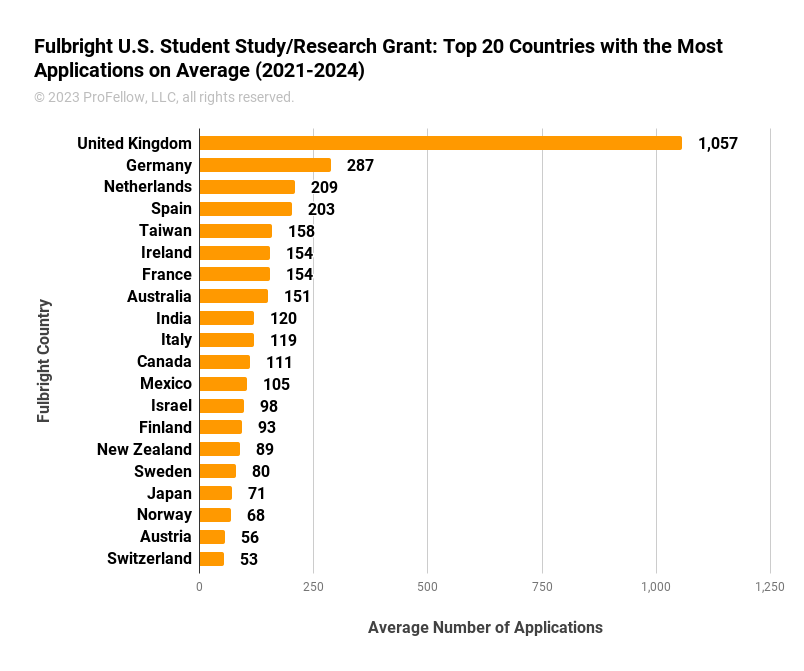
4. Which Fulbright U.S. Student Study/Research Grant countries receive the most applications?
The United Kingdom consistently receives the most Study/Research grant applications. Across 2021-2024, the United Kingdom received an average of 1,057 applications annually, followed by Germany (287), the Netherlands (209), Spain (203), Taiwan (158), Ireland (154), France (154), Australia (151), India (120), Italy (119), Canada (111), Mexico (105), Israel (98), Finland (93), New Zealand (89), Sweden (80), Japan (71), Norway (68), Austria (56), and Switzerland (53).
If you want to apply to one of these popular countries, we suggest getting insights and tips from former Fulbright fellows. At ProFellow, you can read interviews with Fulbrighters in these countries, including our feature on Tyler Pugeda’s Fulbright experience conducting neuroscience research in Germany.
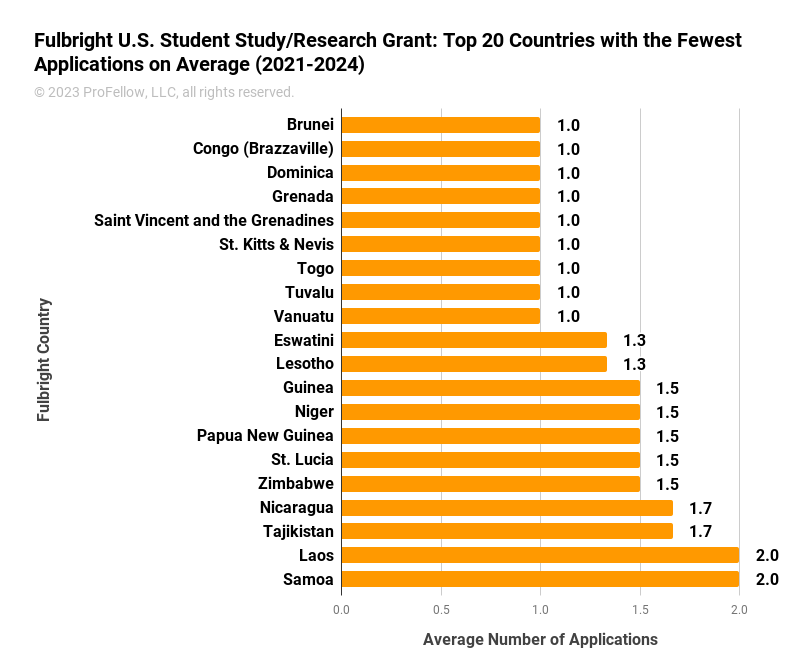
5. Which Fulbright U.S. Student Study/Research Grant countries receive the fewest applications?
On average, the regions that receive the fewest applications are the Middle East & North Africa and South & Central Asia. The chart below shows the top 20 countries that receive the fewest applications, on average. These countries typically receive from 1 to 2 applications per year: Brunei (1), Congo (Brazzaville) (1), Dominica (1), Grenada (1), Saint Vincent and the Grenadines (1), St. Kitts & Nevis (1), Togo (1), Tuvalu (1), Vanuatu (1), Eswatini (1), Lesotho (1), Guinea (2), Niger (2), Papua New Guinea (2), St. Lucia (2), Zimbabwe (2), Nicaragua (2), Tajikistan (2), Laos (2), and Samoa (2).
More than 70 countries received less than ten applications per year, on average, during this timeframe. This list includes Albania, Bolivia, Croatia, Dominican Republic, Egypt, Fiji, Panama, Tanzania, Tunisia, Sri Lanka, and Zambia. Be sure to look into the status and eligibility of any countries you consider applying to.
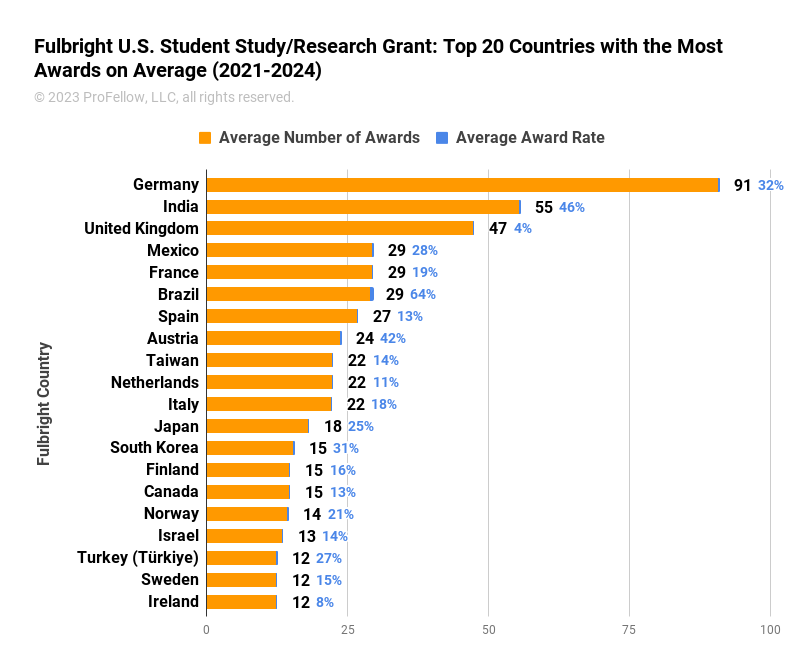
6. Which Fulbright U.S. Student Study/Research Grant countries award the most grants?
Germany awards the most Fulbright Study/Research Grants yearly, with an average of 91, nearly twice as many as India’s average of 55, the runner-up in this category. The United Kingdom (47) and Mexico (29) ranked third and fourth for countries with the most awards provided on average.
Understanding the number of applications and award rates for these popular countries is helpful. For example, the United Kingdom’s average award rate was 4%, Germany’s was 32%, and India’s was 46%! In the top 20 countries with the most awards on average in 2021-2024, the average award rates ranged from 4% (United Kingdom) to 64% (Brazil). Other countries included in this list with above-average award rates include Austria (42%), South Korea (31%), Mexico (28%), Turkey (27%), and Japan (25%).
Applicants considering highly competitive countries like the United Kingdom should consider researching other countries that may give the same number or more awards but receive fewer applications.
7. Which Fulbright U.S. Student Study/Research Grant countries are the most competitive?
The United Kingdom has the lowest average award rate at 4%. The following countries join the U.K. as the most competitive countries for a Fulbright Study/Research grant according to their award rates: Australia (7%), Ireland (8%), New Zealand (8%), Singapore (8%), Kenya (9%), South Africa (10%), the Netherlands (11%), Rwanda (11%), Costa Rica (12%), Senegal (12%), Ghana (12%), Thailand (13%), Colombia (13%), Spain (13%), Canada (13%), the United Arab Emirates (13%), Israel (14%), Kazakhstan (14%), and Taiwan (14%).
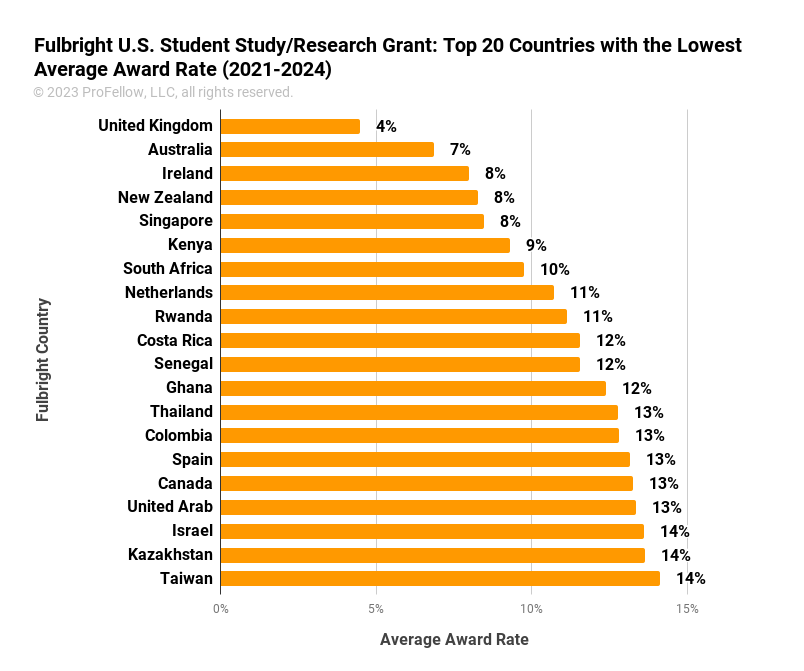
If you are considering highly competitive countries, consider exploring other countries in the region or ones offering similar research or study opportunities. For example, the United Kingdom and Australia had the lowest award rates in 2021-2024 (4% and 7%, respectively). It may be worthwhile also to consider other countries in Western Europe with higher award rates, such as Germany (33%), Denmark (26%), and Portugal (31%), as well as many countries in Eastern Europe, including Luxembourg, Latvia, and Lithuania with award rates over 35%.
Kenya had the sixth-lowest award rate in 2021-2024 (9%). If you want to apply to Kenya’s Fulbright program, consider other countries in sub-Saharan Africa without foreign language requirements, such as Nigeria (27%) and Sierra Leone (32%).
8. Which Fulbright U.S. Student Study/Research Grant countries are the least competitive?
The top 20 countries with the highest average award rates during this period are Zimbabwe (100%), Vanuatu (100%), Tuvalu (100%), Tajikistan (100%), Papua New Guinea (100%), Dominica (100%), Congo (Brazzaville) (100%), Brunei (100%), Kuwait (80%), Lesotho (75%), Eswatini (75%), Niger (67%), Latvia (67%), Guinea (67%), Brazil (64%), Bolivia (62%), Bosnia & Herzegovina (57%), Mongolia (55%), St. Lucia (50%), and Samoa (50%).
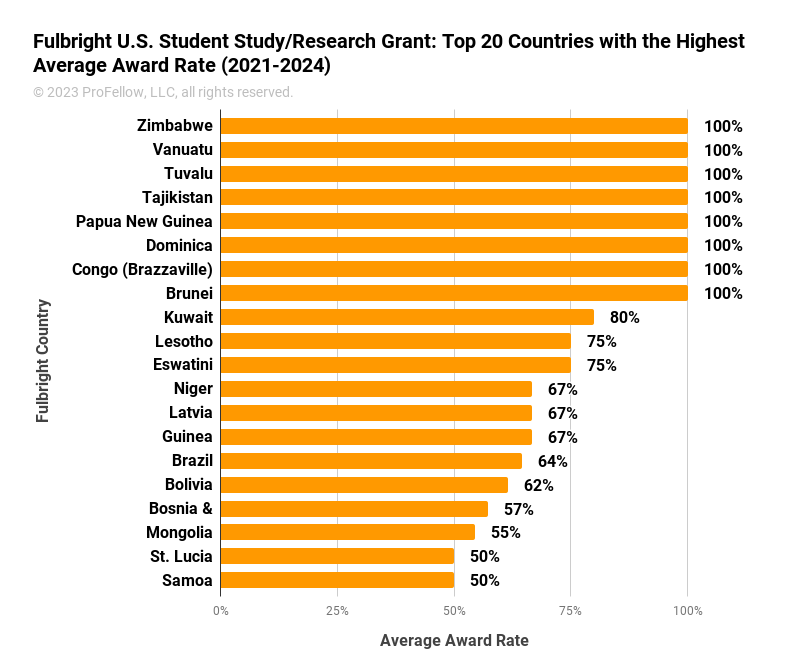
It is important to note that these countries generally receive fewer applications, affecting their award rates. For example, all eight countries with 100% award rates had 1-3 applications for the corresponding period.
Also, one reason these countries may have low numbers of applications could be their eligibility requirements, such as language or specialized knowledge. For example, Moldova recommends some knowledge of Russian or Romanian.
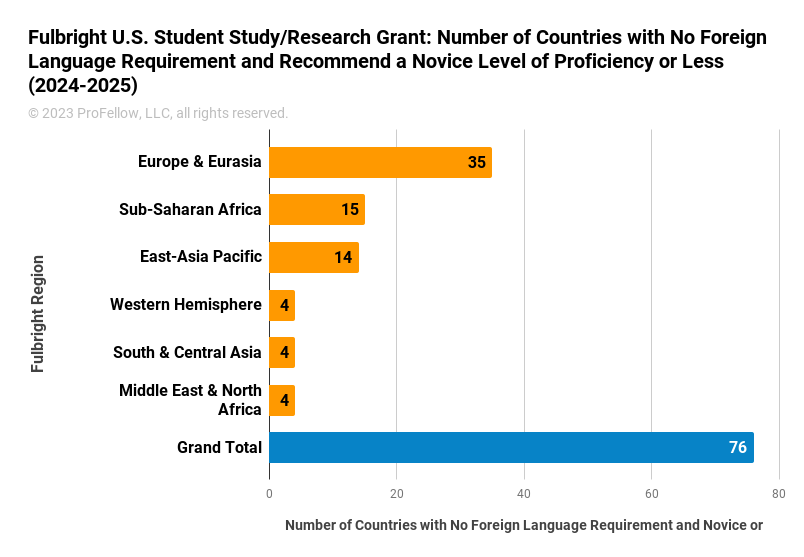
9. Which Fulbright U.S. Student Study/Research Grant countries don’t have a foreign language requirement?
For the 2024-2025 Fulbright U.S. Study/Research Grant year, there are 89 countries with no foreign language requirement. However, some awards recommend having intermediate, even advanced proficiency in a local language. Other awards recommend only having a novice level of proficiency in a local language, which one can quickly gain from a book or a language learning app like Duolingo or Babbel before starting a Fulbright fellowship.
There are 76 countries where you can do a Fulbright U.S. Student Study/Research Grant in 2024-2025, speaking only English (53 countries) or a novice level of proficiency with a local language (23 countries).
Be sure to look into the foreign language requirements for each country you consider applying for. Even if language proficiency is not required, you may be up against candidates proficient in the local language, and some language proficiency may improve not only your candidacy but also your proposed studies or research.
10. Which Fulbright U.S. Student Study/Research Grant countries offer Critical Language Enhancement Awards?
Some Fulbright countries offer Critical Language Enhancement Awards (CLEA) that provide selected Fulbright U.S. Student grantees three to six months of intensive language study in their host country as an enhancement to their Fulbright grant. For example, Fulbright U.S. Student Study/Research Grant applicants to India can apply for a CLEA to study Bangla/Bengali, Hindi, Gujarati, Marathi, Punjabi, or Urdu before their project.
In 2024-2025, seven countries offer Critical Language Enhancement Awards (CLEA awards) for Fulbright U.S. Student Study/Research Grants. These countries are Egypt, India, Indonesia, Jordan, Morocco, Russia, and Taiwan.
If you plan to apply for a Critical Language Enhancement Award, read these tips from Fulbright Study/Research alumna Jennifer Lindsey.
Conclusion
We hope these statistics help you identify the best-fit countries and options for your Fulbright application. However, Fulbright awards aren’t simply a numbers game. Only solid and compelling applications will be accepted. The key is to prepare well using all available resources like your mentors, former Fulbright fellows, and ProFellow. Be sure to tell a story that shows how you and your project proposal or studies connect to the Fulbright mission.
Here are a few resources to help you get on the right side of the statistics:
- Interviews with Fulbright winners
- 100+ Countries Where You Can Pursue a Fulbright Award in English
- How to Choose a Fulbright Host Country: Advice from Two Former Fulbrighters
- How to Create a Winning Fulbright Statement of Grant Purpose
- 5 Feasible Research Methods for Your Fulbright Research Proposal
- How to Apply to Fulbright as an At-Large Candidate
- Top 7 Fulbright Application Tips From Successful Alumni
Best of luck with your application!
Want insider strategies for your Fulbright application? Purchase the Fulbright Applicant Mastermind workshop by ProFellow Founder and Fulbright Award Winner Dr. Vicki Johnson.
© 2023 ProFellow, LLC, all rights reserved.